This application was created to be used as an extra tool with our Senior Design project, Household Air Quality Sensor. I took this as a learning experience in order to familiarize myself a little with C# and SQL databases. Hover over each section to learn more about the element.
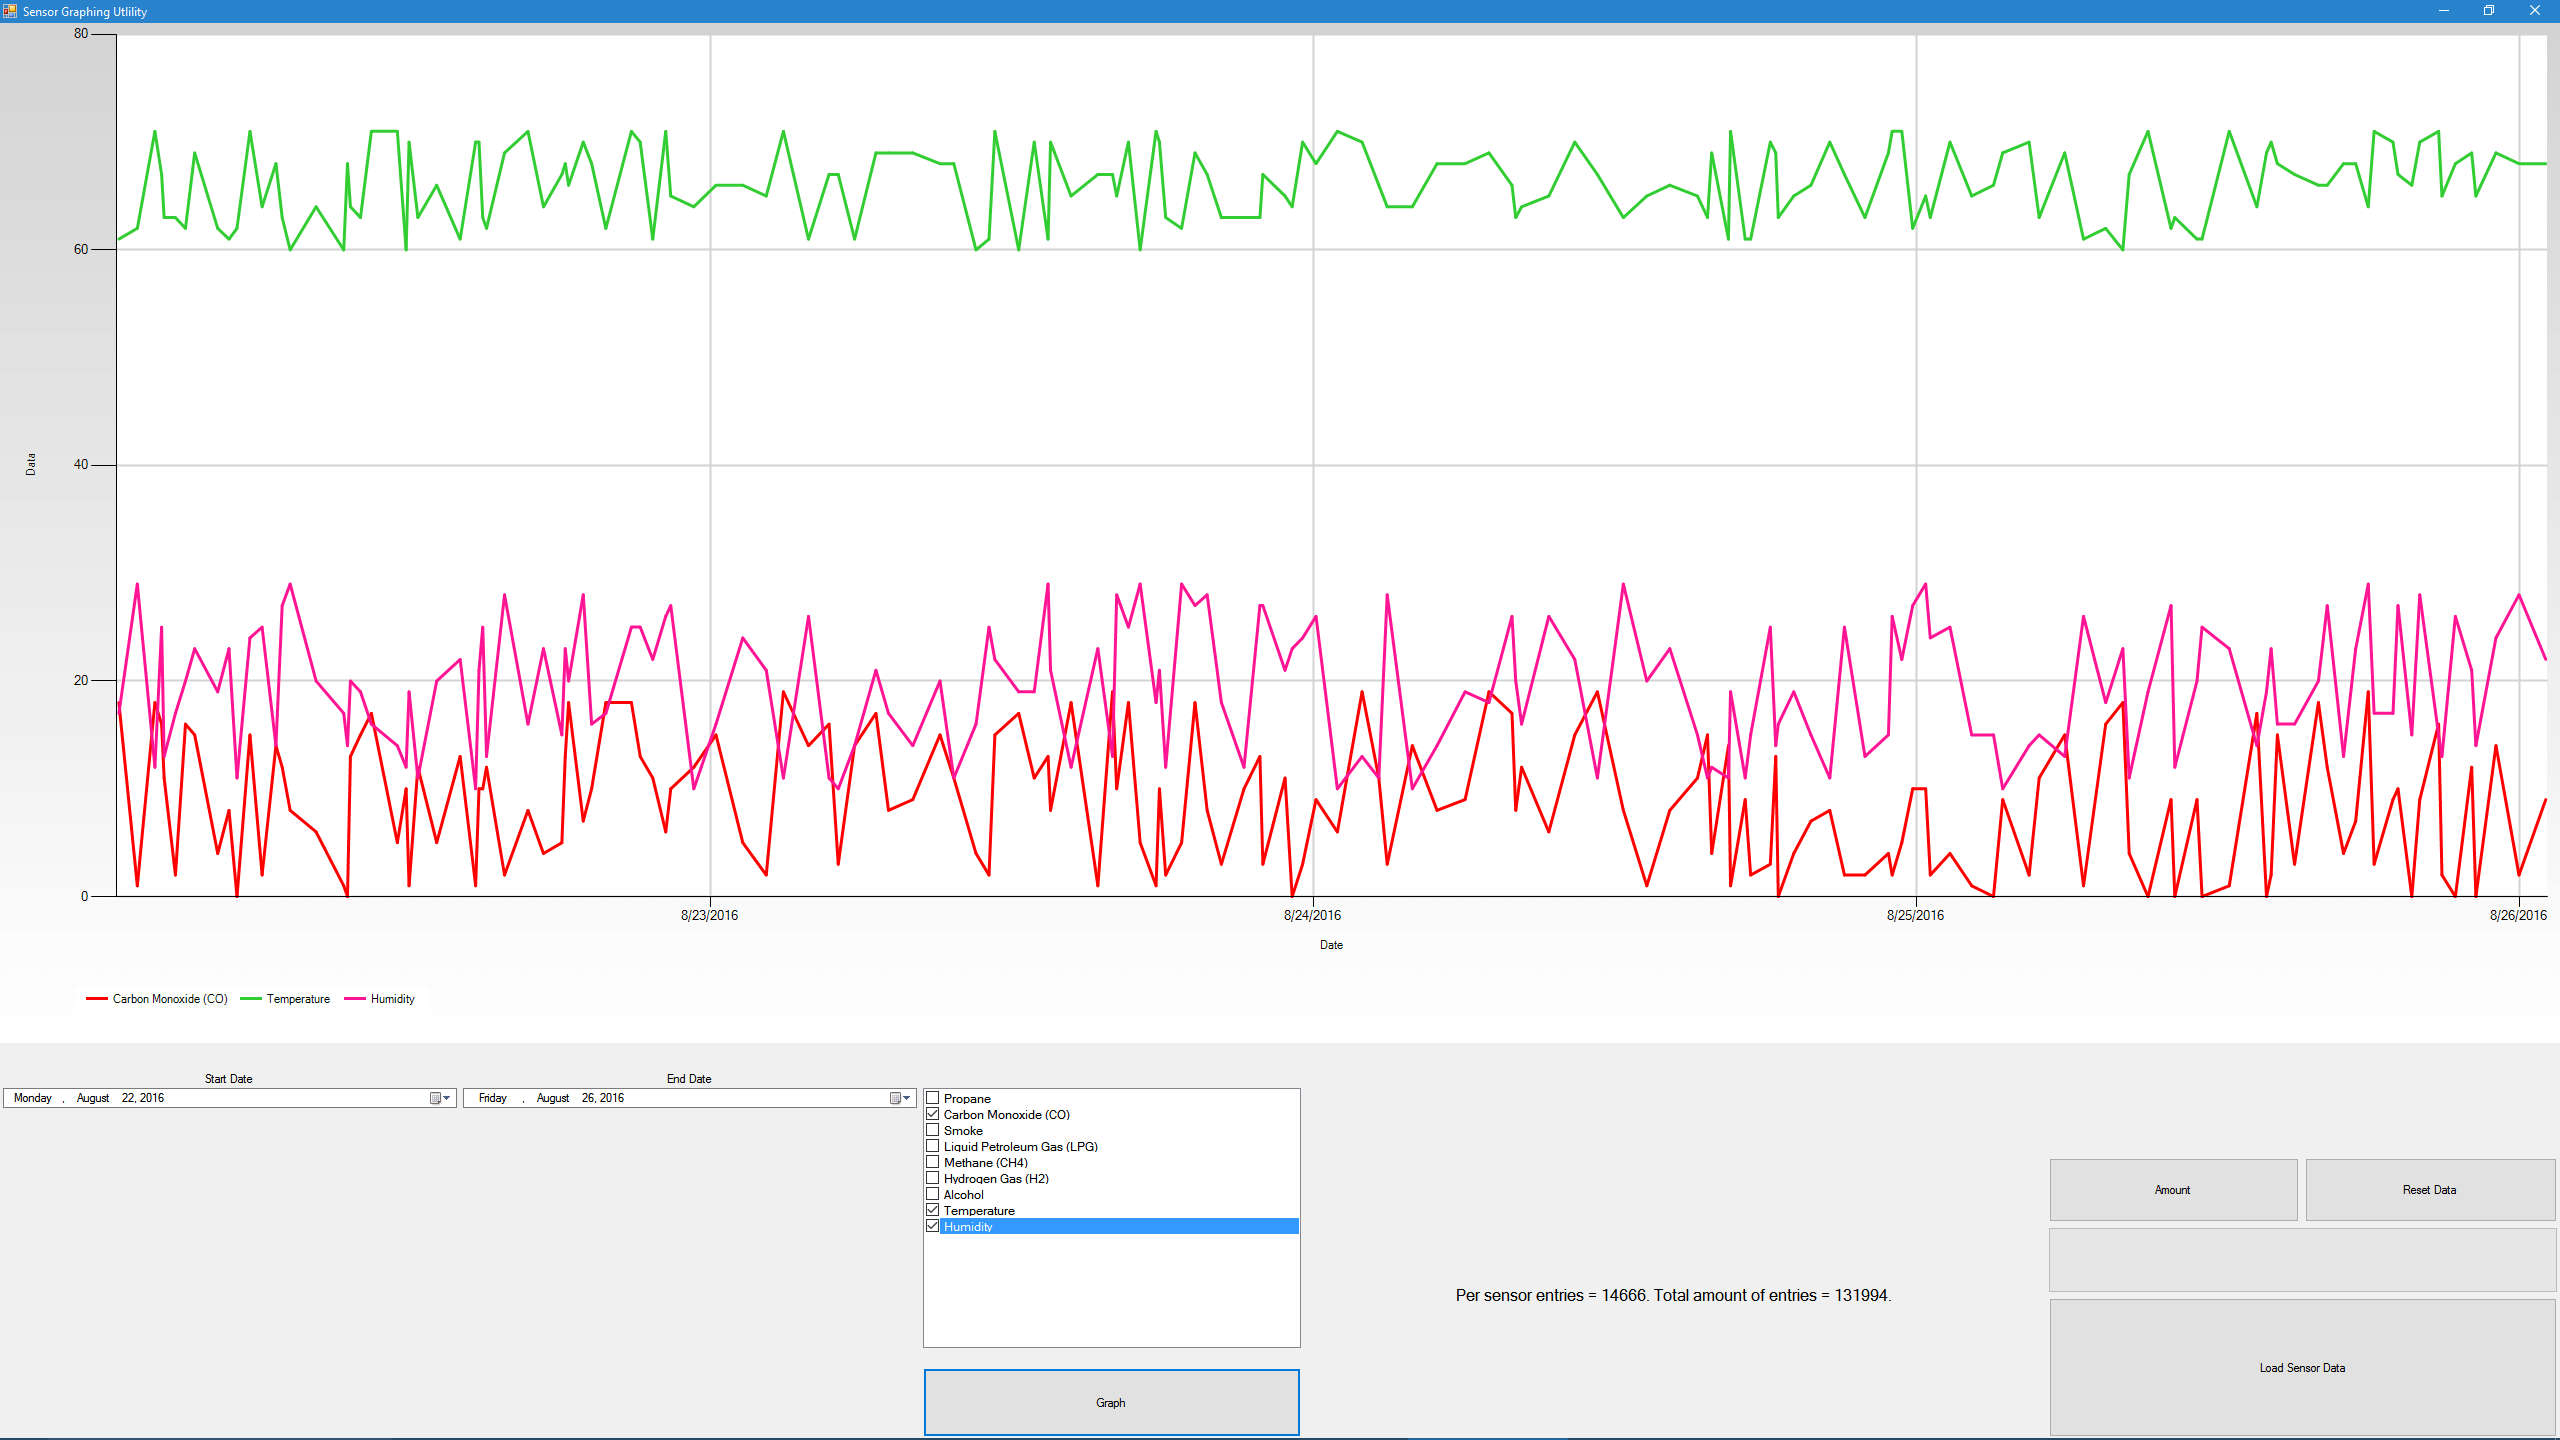
Here is shown the data for carbon monoxide, temperature, and humidity over the course of a week. The legend in the bottom left shows which color belongs to the element it is describing. The dates are shown along the x-axis and the numerical data for the items are along the y-axis. All the data is combined in one but is relative to one another. The temperature is in Fahrenheit, the humidity as a percent, and the gases are in parts per million. Currently, the temperature is around 60 to 70 degrees, the humidity around 20 to 30 percent, and the carbon monoxide concentration around 10 parts per million. This is also random data to show extreme cases.
Clicking on the calendar icon will bring up a calendar where a start and end date can be selected.
Select items here and click the graph button to display the information above on the graph.
Information is displayed here such as: amount of entries per gas, if there is data previously saved or how much is saved.
The buttons here will display the total amount of data in the information section, delete all entries, and loading in new data from an SD card with a loading bar to give a time estimate.